Demo & Gallery
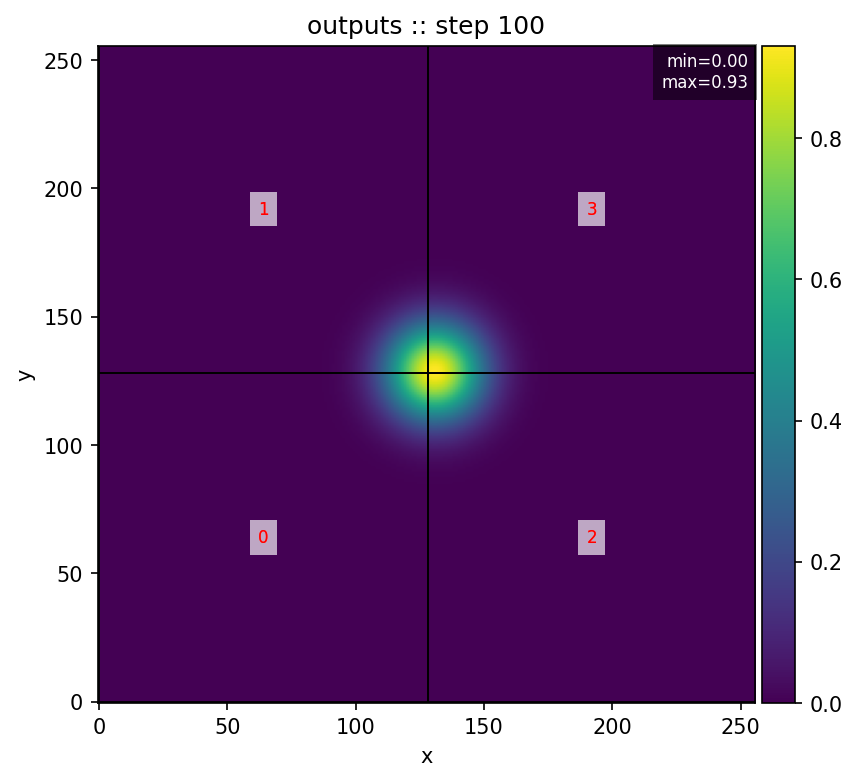
Below is a short animation from a 2D Gaussian hotspot diffusing and advecting to the right. The simulation was run on 4 MPI ranks with periodic BCs and saved every 10 steps.

Reproduce: see Getting Started for the exact dev.yaml and commands.
Add overlays

Reproduce Same simulation run as Getting Started then python -m visualization.cli show --dir outputs --fmt nc --step 100 --overlay-rankbox --overlay-minmax --overlay-rankgrid